A Cultural Project
Here I made a cultural project about 1992 Los Angeles riots.
Purpose
This project was designed to recall the history in the perspectives from different ethnic groups, with a mainstream media timeline for comparison. The map can you walk you through the event in a flat LA space layout.
To see LA Times timeline for comparison: Click here
Map Comparison
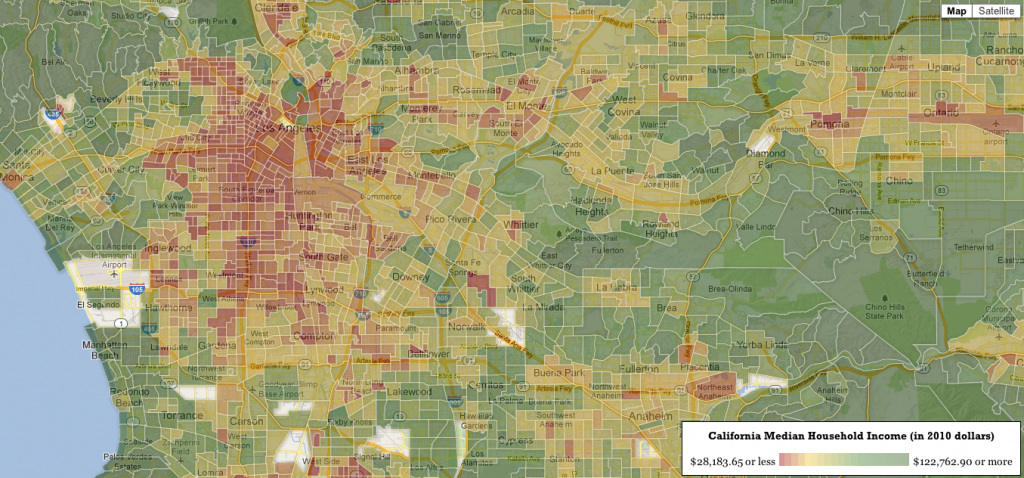
Map of Los Angeles by Average Household Income
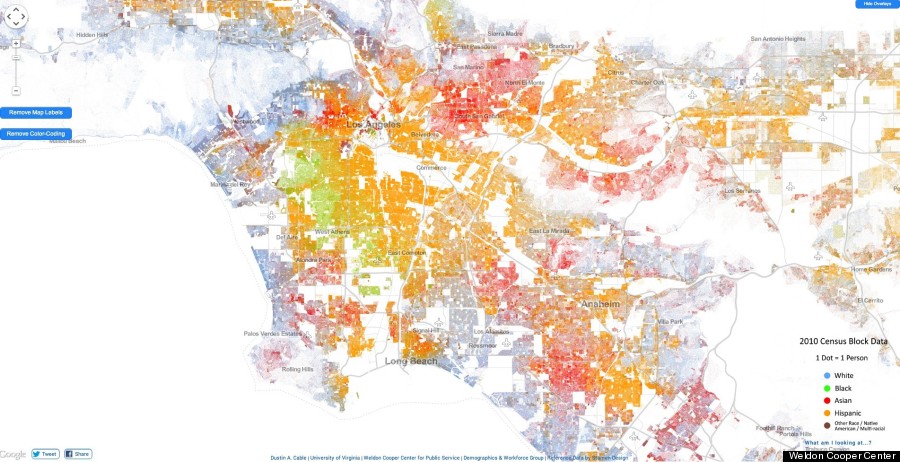
Racial Dot Map In LA Highlights Segregation By Neighborhood
The two maps above indicating racial and economic dispersion of LA can be compared with the map provided by this site. The violence of the riots in 1992 happened most in areas of the non-white, low-income households.
References
Images:
- AP Images: Click here
- LA Times: LA Times Timeline Photos
- Other websites: stolinsky.com
Videos:
- YouTube (links embedded in player)
- LA Times: LA Times Timeline
Maps:
The maps uses Google Maps data with customized markers. Coordinates are parsed manually.
Texts:
Most texts are hand-written. There are textual explanations from the following sources:
- AP Images: Click here
- LA Times: LA Times Timeline
- Wikipedia: Click here
- Anna Smith’s Twilight Los Angeles, 1992